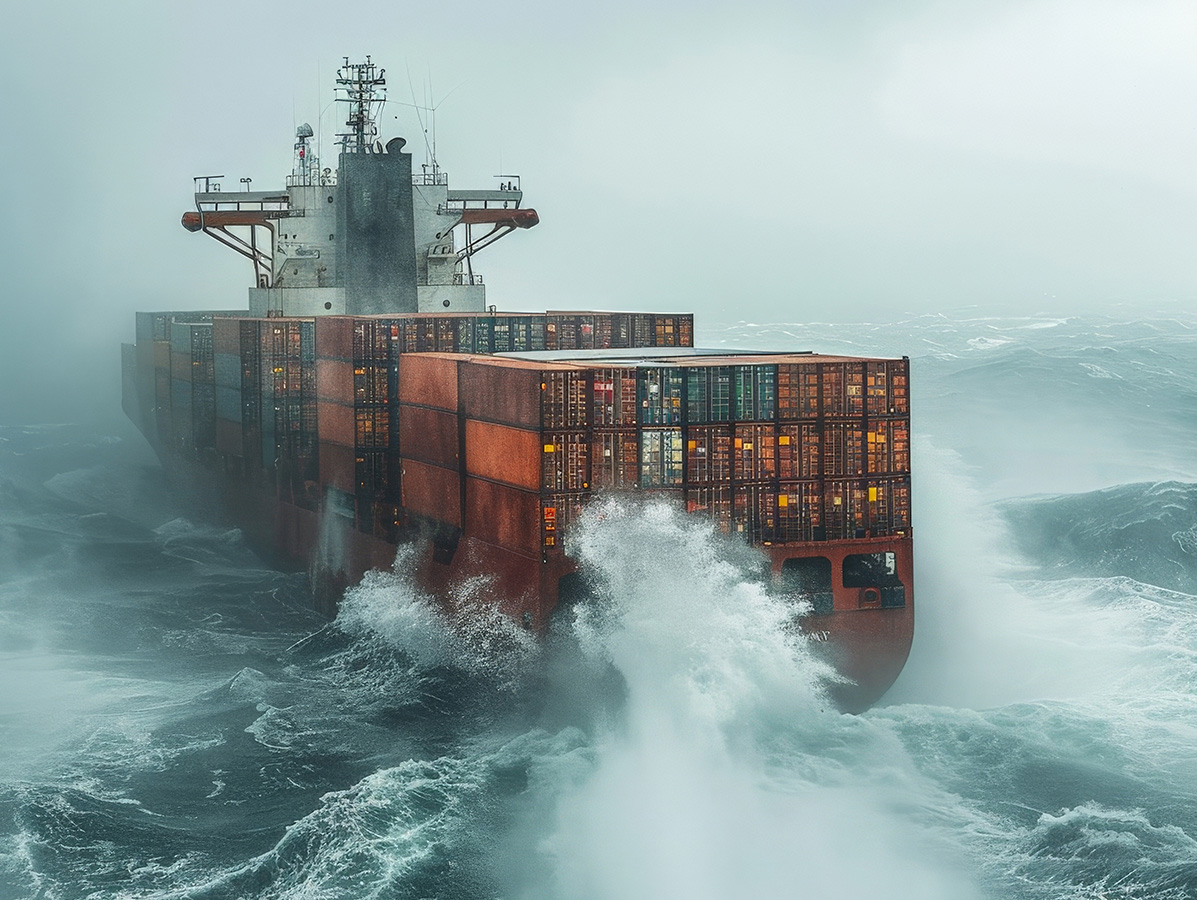
Logistics risk shown with cargo ship

Quantifying the Cost of Production Stoppages

Supply chain professionals need to ensure a reliable supply of materials.

A disruption in the supply of a critical component can halt production, leading to missed deliveries, unsuccessful promotions, customer churn or lost sales. All of these can have a negative impact on the bottom line.

Supply chain leaders can calculate the expected cost of s production stoppage in three different ways:

  • Revenue at risk
  • Direct costs
  • Indirect costs

Revenue at Risk

Every minute that a production line is in operation, it creates value for your company. The converse is also true: every minute the line is down value is being lost.

To calculate the revenue at risk, you need to know the throughput of the line and the wholesale price of the final product.

Consider a disruption your company experienced because of the unavailability of a critical component or raw material.

  • How many productions hours were lost per line?
  • How many productions lines were impacted?
  • How many final products were not completed during the downtime?
  • What is the wholesale price of the product?

Determine the number of units that would not be produced during a stoppage and multiply that by the wholesale price.

However, the way that you will do this depends on whether you use discrete, process, or contract manufacturing.

Discrete Manufacturing

Let’s take a very simple example.

However, this is discrete manufacturing, and other parts of assembly can continue while a component is missing. Therefore, the revenue at risk is not the same as the total value. Depending on your industry, you could conservatively estimate it as a percentage of the total value.

One of our customers, a global automotive manufacturer, calculates the revenue at risk as 10% of the total value.

Process Manufacturing

As this is process manufacturing, and no part of the process could take place without the missing ingredient, the revenue at risk is the total amount calculated.

Companies Outsourcing Production to a Contract Manufacturer

This model evaluates revenue-at-risk for companies that use contract manufacturers, where the primary exposure is losing a scheduled production slot rather than experiencing a line stoppage.

The primary risk is missing your allocated production window. You cannot make up for lost time. Contract manufacturers run fully booked schedules.

If you miss your production slot due to missing components, the disruption cost is equal to the total profit you would have made for the period the production slot would have covered.


WHY CONTRACT MANUFACTURING IS DIFFERENT

  • You don’t control the line.
  • You can’t recover lost time.
  • Contract manufacturers run at high utilization.
  • Your slot is your production capacity.

Your value at risk is 100% of the profits you would have made for that production period.

Beverage manufacturing

Direct Costs

Direct costs are the immediate, traceable expenses triggered by the disruption. These typically include:

  • Idle labor costs (internal teams waiting on product)
  • Overtime to recover downstream processes
  • Expedited shipping for replacement components
  • Customer penalties or chargebacks


Indirect Costs

Indirect costs reflect the organizational effort required to manage the disruption. McKinsey estimates that companies spend two weeks planning and executing a response to a supply chain disruption.

To calculate indirect labor costs, convert salaries to hourly rates using 50 working weeks:

Depending on your company, one of these may make a better framework than the other; or a combination of two or more may make the most sense for the way your company is organized.

Value at Risk: The Key Takeaway

While you can use any of these formulas to calculate the costs of a disruption, it is more powerful to consider them together. This is your value at risk calculation.

Value at risk = Revenue at Risk + Direct Costs + Indirect Costs

strategische entscheidungen sub-tier transparenz

Our Customers Get Results

Faster reaction to disruption

A global life science company cut hurricane-impact assessment from 10 people over 14 days to one analyst in half a day. A global automotive OEM reduced earthquake contingency planning from 48 hours to 2 hours, protecting an estimated $40M in production value.

Hard cost avoidance

A specialty chemical company secured $1.3M in shipments with zero added freight surcharges after an early flight suspension alert. An automotive company saved $1M on a single purchase by locking in buffer stock ahead of a cyberattack-driven price spike.

Lower cost to operate

Logistics and 3L customers have cut time spent managing shipment exceptions by up to 70% and reduced unplanned expedited freight spend by up to 5%.

Fewer production stoppages

A global industrial manufacturer reduced production stops by 40% year over year and enabled same-day reaction to 80% of incidents. Automotive Tier-1 suppliers cut response times by 25–50% through sub-tier risk mapping.

Better on-time performance, less revenue loss

Customers using shipment level monitoring have improved on-time-in-full delivery by 2–5% while reducing disruption-related revenue loss by up to 30%. One global CPG manufacturer eliminated frozen-load losses through predictive temperature routing.