Nearly 1,000 global companies have signed a pledge to be net zero by 2050. The Net Zero pledge raises the bar when it comes to benchmarking your business against others, and when others evaluate your operation.
To establish, maintain, and document a meaningful carbon emissions policy you’ll need convincing metrics that go beyond “greenwashing.” A robust policy with meaningful data will help you benchmark yourself against industry leaders, stay competitive to attract customers and investors, and hold company value.
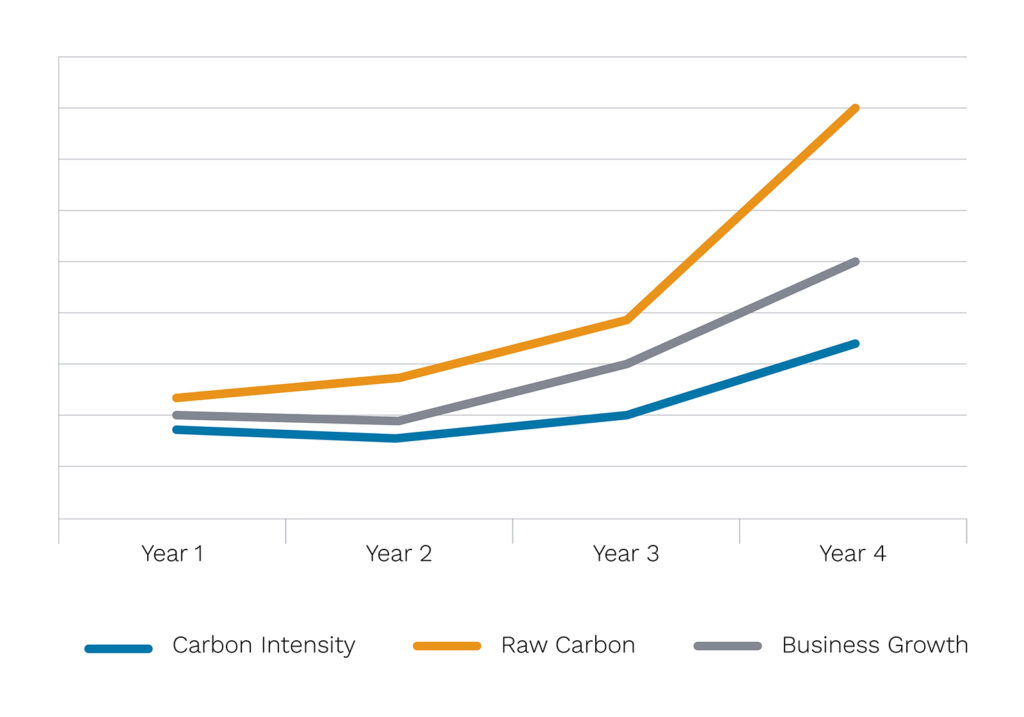
Figure 1: Efficient company growth should be more closely aligned with a carbon intensity score instead of raw carbon emissions.
Why measure carbon intensity vs emissions
Carbon intensity is a measure of carbon dioxide and other greenhouse gases (CO2e) per unit of activity, like generating a product. Carbon intensity monitoring calculates the precise amount of carbon emissions required to produce and move materials from the source to the shelf.
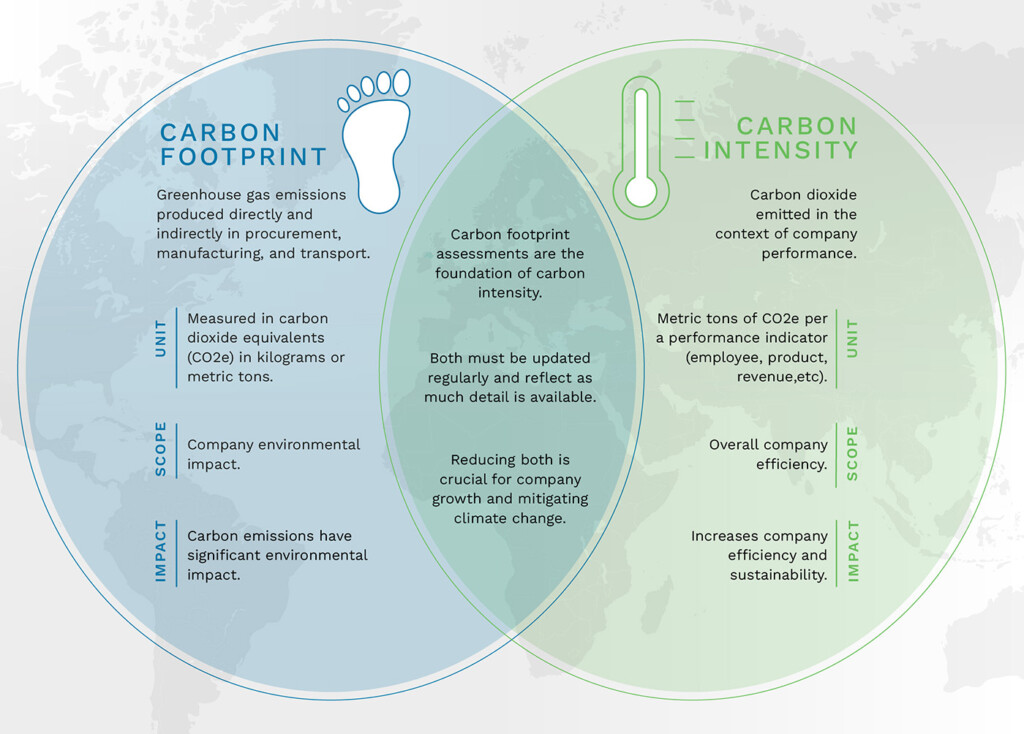
Figure 2: Carbon intensity score differs from simply measuring carbon footprint, although there is overlap to be leveraged by companies already measuring carbon footprint.
Supply chain data is the main component of measuring carbon intensity, and is often the largest percentage of emissions used in a product’s life cycle. So, carbon intensity metrics depend on capturing full and accurate data for all tiers of a product’s supply chain.
Then companies can contextualize that data further. Measuring emissions by a company’s square footage can create a meaningful metric for industrial warehousing, for example. Measuring emissions by employee might be more appropriate for a software or other service company. And measuring by product makes sense for consumer goods operations.
Companies can use carbon intensity data for several applications, most importantly for compliance and reporting. Companies must be able to report the amount of carbon associated with their business activities for a variety of existing and emerging regulations. Carbon intensity captures more accurate and meaningful data to share with stakeholders.
Also, carbon intensity data anchors emissions to operations. This shifts the information from something only shared externally to something that can also support internal operations. Carbon intensity data can become a meaningful business metric for measuring business results and benchmarking against best-in-class or against the competition.
AI captures meaningful metrics
The AI tools used by Everstream Analytics and BlueNode can dig deeper and get to the commodity level. That’s when the metrics can reveal granular data – for example, a specific box of cereal took .0001 grams of carbon to get it to the store shelf.
AI and machine learning can also ensure accuracy. Data cleansing is critical for standardizing names, fixing addresses, and incorporating commodity codes, for example. All metrics must go through data cleansing, integration, and analysis to enhance accuracy. With Everstream’s acquisition of BlueNode, our process includes:
- Enhanced understanding of vessel performance and analytics, port call optimization, and end-to-end cargo visibility with port operations data.
- Automation of maritime shipping data cleansing from bills of lading, customs declarations, and other documents in EDI, XML, spreadsheet, and paper submissions, reducing a labor-intensive and error-prone process.
- Accurate measurement of carbon and Scope 3 emissions from ports, terminal operators, maritime and rail carriers, shippers, and trade authorities.
- Insights to reveal and diagnose anomalies in trade data, including counterfeit, fraud, or dangerous goods violations.
When collecting supply chain emissions information, vast amounts of data must be parsed and cleansed. For example, “Asian tires” may be a bill of lading description, or “this container is said to contain X.” Sometimes there are 50 commodities in a commodity description. Our process can determine what is actually in the container, and how much it weighs as a proportion of the container.
Measuring emissions as just a number has no meaning – the data is only useful if it’s in context. Make sure that your team understands how to capture your carbon intensity score as a meaningful business metric linked to operations.