Last winter’s polar freeze and this summer’s record heat show how climate change is giving us more of everything. More extremes, more roasting heat, more storms, more drought, and more flooding. As we transition into an unusually strong El Niño year, global weather patterns will be even more disrupted.
The fact is our weather is shifting. If your team is relying on historical weather records to plan operations or transportation, you’re not incorporating major climate change trends into your strategy. Without long-term forecast insights, you’ll face more surprise delays, more missed shipments, and higher delivery and penalty costs.
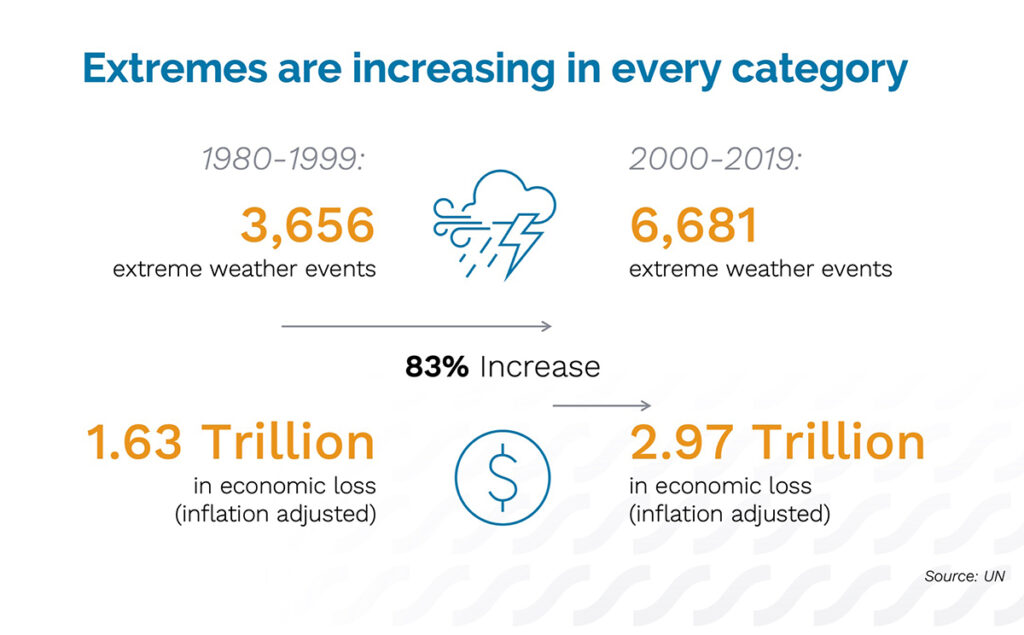
Figure 1: Climate proofing is increasing in strategic importance as it drives rising costs.
How much is this oversight costing you? Our analysis quantifies the cost of extreme weather disruption and reveals the strategy that the top 3% of supply chain operations are using to avoid disruptive climate costs.
Why the weather is getting worse
For the first time in modern history, all parts of the climate system are breaking records. The globe is heating up, with temperature hikes for both sea and air.
This unprecedented rise in global air and sea temperatures is prompting a surge in weather disturbances. The escalating warmth of our oceans is magnifying storms, while the burgeoning global air temperatures are broadening the reach and intensity of heat waves and droughts.
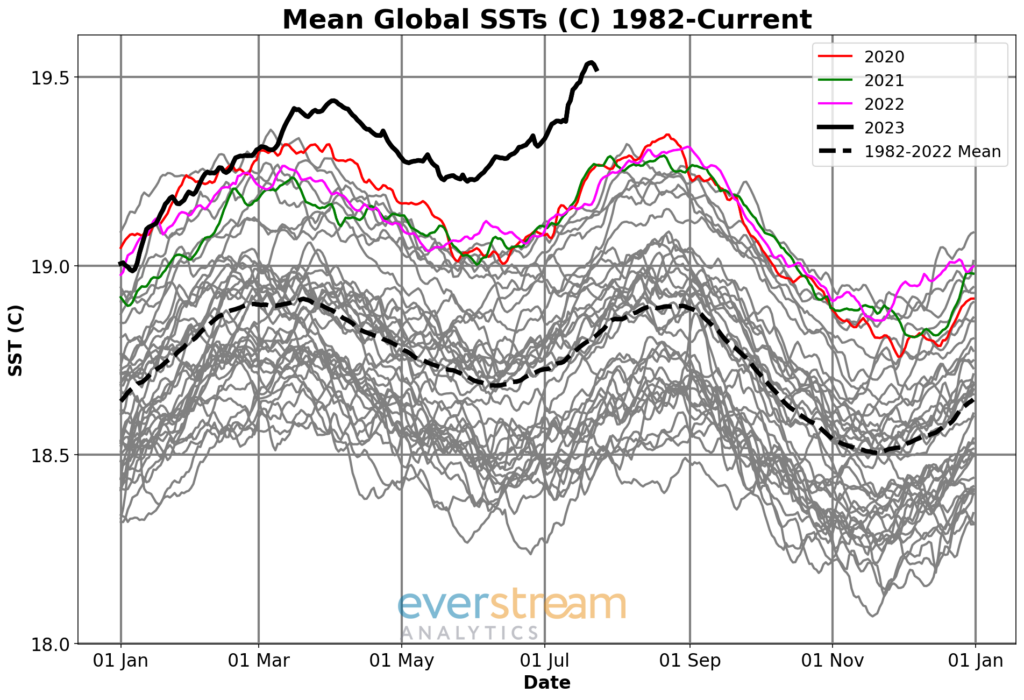
Figure 2: Daily average of global sea surface temperatures (SSTs) during the past 40 years (source: Everstream Analytics).
Our oceans have heated up to temperatures we’ve never recorded before. In the last three months, sea surface temperatures (SSTs) have scaled new heights. Over recent decades, the oceans have absorbed most of the heat from the climate system.
Click here to download the PDF
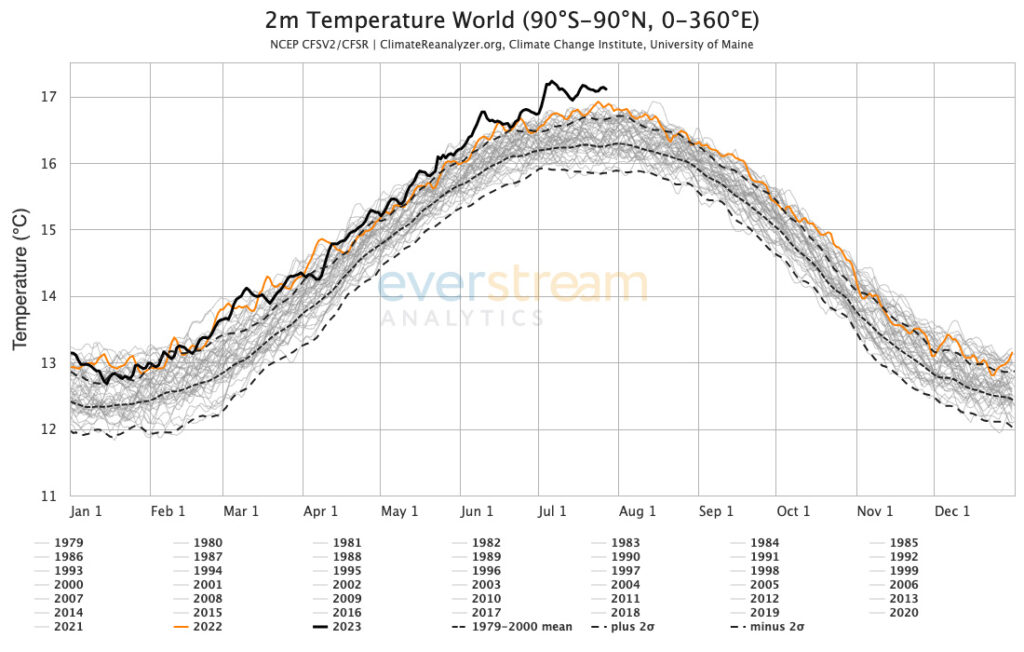
Figure 3: Daily average global temperature every year from 1979 to now (source: Climate Change Institute, University of Maine).
Many parts of the world’s oceans are now hotter than ever, with some areas experiencing temperature jumps of 3–5 degrees Celsius. The fiercest marine heat waves are happening in the North Atlantic, Mediterranean, North Pacific, and equatorial Pacific, where a powerful El Niño event is taking place.
For air temperatures, June shattered the previous heat record worldwide, with countries including China, Vietnam, and India experiencing their hottest June in history. After June, July also set record temperatures worldwide. National heat records fell in Rome, Italy, and Sanbao, China.
The average global temperature for July exceeded 17 degrees Celsius. Throughout most of July, the global temperature hovered above this new peak, highlighting the swift and alarming advance of climate change.
Climate change cost analysis
Extreme weather creates high risks for employee health and safety, livestock health and safety, crops and global food supply, manufacturing, and more. Logistics and transportation suffer frequent delays and missed deliveries, which trigger stiff penalties for supply chain operators. The bullwhip effect means that these impacts only increase over time.
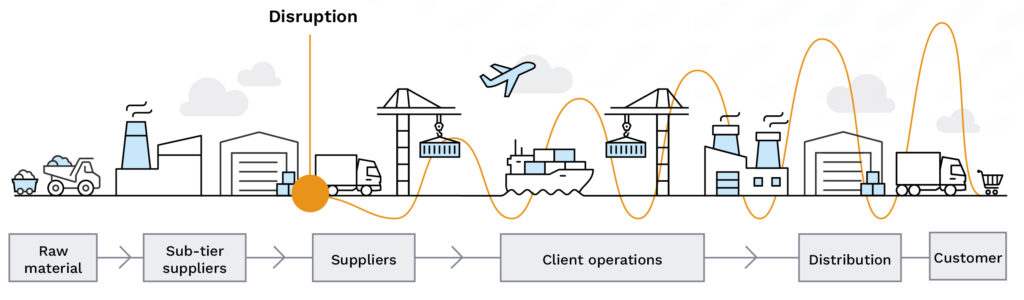
Figure 4: Identifying and climate proofing against extreme weather risks early prevents bullwhip effect costs.
Anecdotally, shippers know that bad weather creates delays and cancellations, but by how much? We analyzed four extreme weather events during the past 12 months to quantify the impact. Our analysis showed that extreme weather events delay shipments by an average of two or more days—a potentially costly gap for companies facing stiff penalties for late deliveries.
In addition to delays, we found that up to 75% of shipments were canceled altogether during extreme weather events. This combined chance of delay or cancellation creates a very high risk for shipments on lanes with forecast weather disruptions.
Depending on the weather event, your operation can calculate what the delivery delay or cancellation would cost in terms of recovery, alternate plans, and penalties.
More delays and missed deliveries
Everstream analyzed shipments during several different types of extreme weather to understand the growing impact on logistics. As the number of change events grows, operations will experience more delivery delays and cancellations.
Hurricanes
Hurricane Ian’s first landfall on the Florida coast was one of the most disruptive weather events of 2022. From Sept. 28–30 the storm resulted in a 75% drop in shipments compared to previous weeks. Deliveries that did make it saw an average increase in shipping times of 2.5 days.
Winter storms
The widespread deep freeze across Texas from Feb. 11–20, 2021, resulted in an average delivery delay of almost two days. And in Buffalo, NY, the Christmas freeze of Dec. 21–26, 2022, caused a 40% decrease in shipments from previous weeks.
Wildfires
During the Canadian wildfires in June 2023, both Chicago and New York City struggled with poor air quality and low visibility. Deliveries in Chicago from June 26–28 and in New York City from June 5–7 were delayed by up to two days. Reduced visibility due to wildfire smoke caused decreases in the number of shipments in different areas from 50%–75%.
Flooding
Flooding and heavy rains in California, Nevada, and Utah in the spring of 2023 interrupted transportation across the entire region. The ongoing disruption caused a 20%–30% decrease in shipments in the impacted areas.
How the top 3% responds
Relying on historical weather records, hoping for good weather, and responding when bad weather hits is no longer an effective supply chain strategy. Remember the bullwhip effect: The later your response to a weather event, the more factors are affected, and the more expensive a strategy shift is.
Instead, our research shows that leading companies are moving from the most efficient shipping strategy to routing that is more reliable.
Everstream analyzed nearly five million U.S. shipments during a three-month period in 2019 and 2023 to understand what lanes supply chain managers are using. When we say a shipment “lane,” that is a combination of geographic route, transport mode, and specific carrier. We broke shipments into 100-mile segments to measure how much delivery times varied for each. Then we divided the lanes into low- and high-variance groups.
We found that from 2019 to 2023, 3% more shipments utilized lanes that had lower variability in delivery times. That’s over 70,000 shipments shifting to more reliable routes. And anecdotally, some Everstream clients tell us that they will pay more for lower variance routes, modes, and carriers.
Obviously, not all shipments require a higher-cost option. The best way to manage the risk of weather disruption is to go beyond basic forecasting and assumptions. Throw away obsolete weather modeling and get the climate-change-informed predictions, event context, trends, and actionable insights that help you identify and prioritize lower-variance and lower-risk options.
How does the 3% shift play out in practice? One Everstream client’s business is providing materials to their customers that are critical for manufacturing operations. An unexpected shipping delay could potentially shut down a customer’s entire plant, and damage or end that relationship. Because providing materials is mission-critical for this Everstream client, shipment delays are an unacceptable high risk.
The company has shifted away from the more efficient and lower-cost option of ground trucking because that lane has a higher variance. Instead, this client now invests in more expensive but lower-variance air freight. This investment pays off in continued smooth operation of their customers.
Click here to download the PDF
The long-term forecast
High volumes of high-impact weather/climate events will likely persist until the end of 2023. Everstream’s Applied Meteorology and Climate Team forecasts that episodes of heat, regional drought, wildfires, flooding, and cyclones will continue to exert pressure on people, crops, the electric grid, and the supply chain. Moreover, El Niño conditions will intensify by year’s end, exacerbating regional dryness and drought in Southeast Asia and Australia.
These harsh conditions stand to exert additional stress on an already taxed global food system. Everstream’s experts anticipate that river logistics will become increasingly problematic later this year as the Mississippi and Rhine Rivers already exhibit low water levels. Similarly, El Niño’s characteristic reduced rainfall across Central America may potentially further disrupt Panama Canal operations due to declining water levels.
Everstream’s weather modeling uses artificial intelligence (AI) and machine learning combined with human expertise to analyze today’s climate-change weather patterns, then predict and score increased risk to specific lanes, regions, and supply networks. AI leverages billions of daily data points, historical trends, and operational data, guided by experts in applied meteorology and climate intelligence. This process creates sharp, future-looking insights that support your unique supply chain risk management strategy.
Everstream’s AI-based risk management platforms with weather monitoring can create 14+ day forecasts that are relevant to your operation and business priorities. Intra-seasonal meteorology can create up to a six-month forecast for climate change and related seasonal weather, with actionable risk scoring applied to forecast data for decision-making. Long-range forecasts can help you quantify climate and water risk and their impact on your supplier network, locations, crops, raw materials, lanes, shipments, and more.
Enhanced short- and long-term weather outlooks that incorporate the reality of climate change support today’s business decisions that affect revenues and expenses.
Jon Davis leads the Everstream Analytics weather and climate team as Chief Meteorologist. With over 35 years of experience, he is widely considered one of the foremost experts on the impact of weather and climate on global commodities and business.