Ian was second costliest event of the past 10 years only being surpassed by Hurricane Harvey in 2017. Since the turn of the century, Ian was the 3rd costliest disaster after Hurricanes Katrina and Harvey. Unfortunately, Ian also was the top event in the category of fatalities with 152 confirmed deaths directly attributed to the storm.
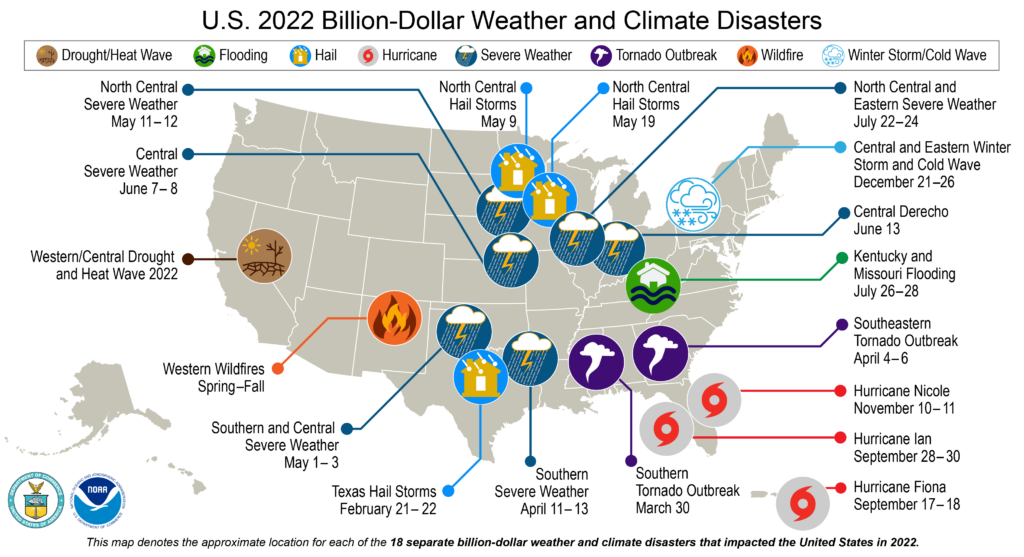
$22 billion dollar disaster: Central heatwave
The second most costly event was the western/central U.S. drought and heatwave which lasted most of 2022, peaking in late summer and fall. Agriculture, livestock, and industries requiring abundant water took economic losses that totaled $22.2 billion. Even worse, 136 fatalities were attributed to the heatwave.
Although California was inundated with rain at the end of the year, this drought is still ongoing in parts of the affected region. Drought impact will continue well into 2023.
$4.8 billion dollar disaster: Christmas freeze
For the third event, a widespread snowstorm and freeze covered much of the U.S. east of the Rockies during the Christmas holidays. Widespread record cold temperatures and historic snow hit key cities including Buffalo, New York. The winter mix proved deadly during the busy travel period, with 87 fatalities (many around Buffalo) directly attributed to the extreme weather. Financial losses due to power outages, travel disruptions, infrastructure damage, and frozen and burst water pipes in homes and businesses totaled $4.8 billion
Losses are increasing yearly
Total losses in 2022 via major weather/climate events exceeded $165 billion (again, not including the Christmas winter storm/deep freeze). The known losses in 2022 make it the 3rd worse year since 2000 (with all economic data CPI-adjusted). The year with the highest losses is 2017 (Hurricane Harvey, Hurricane Maria, and Hurricane Irma) while the second is 2005 (Hurricane Katrina, Hurricane Wilma, and Hurricane Rita).
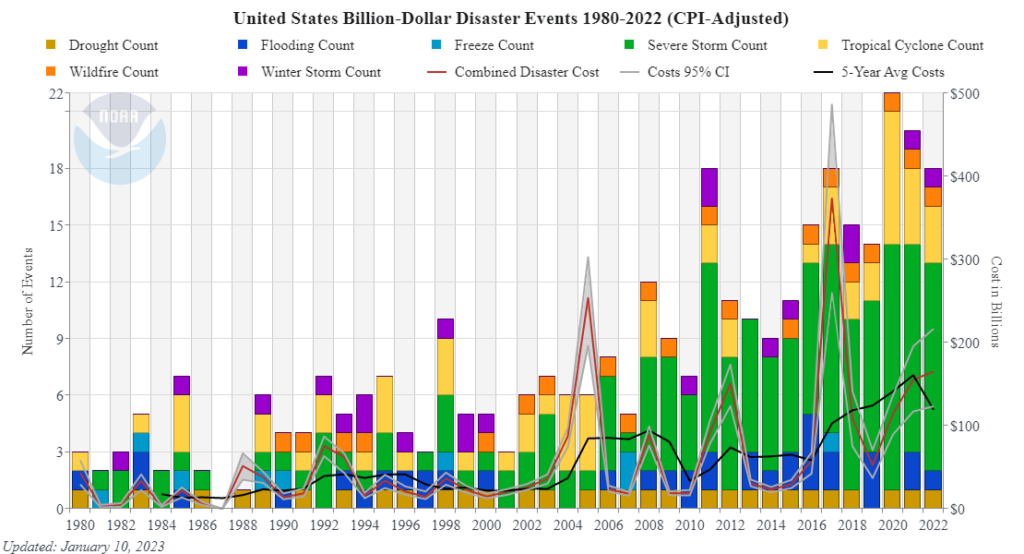
Figure 3: Financial losses are mounting each decade, even when corrected for inflation. (source: NOAA)
The frequency of these major events has been increasing. Hence, the supply chain risk is growing from disruptive weather events. The losses in 2022 will be over $165 billion (once the Christmas freeze is added), far higher than the average of the past five years of $119 billion.
Average financial loss due to extreme climate change is growing, even when dollars are adjusted for inflation:
- 1980s, $21 billion
- 1990s, $31 billion
- 2000s, $59 billion
- 2010s, $93 billion
The increased risk shows up in every aspect of the data – higher frequency of events in virtually every category and higher magnitude of economic losses. The increase in extreme weather events has been a phenomenon in the U.S. and around the globe and is in the DNA of climate change. All indications point to these trends continuing in the future.
Save your supply chain network from billion-dollar disasters
Eyes everywhere and powerful analytics can make every link in your supply chain smarter to adapt to short- and long-term global ESG risks including climate change, extreme weather, and water availability. Whether the threat lies in your Tier 1, far down your supply chain, or in another country, updated risk scores warn you of likely weather disruptions at your suppliers and their suppliers. Learn more about how supply chain analytics protect against billion-dollar weather disasters.