Independent truckers protesting the State of California’s Assembly Bill 5 ended their actions at the Port of Oakland. The disruptions were made worse by the fact that ILWU workers refused to cross picket lines because they believed the protest created an unsafe work environment. The port was forced to completely suspend operations at the Oakland International Container Terminal, which handles 70% of container traffic into the port, due to the lack of workers. The situation highlights the speed at which port stoppages can occur on the U.S. West Coast. The expiration of the current contract, and the no strike clause within, prevents ports from reviewing the legality of any work stoppages.
While wait times for vessels arriving at U.S. West Coast ports has improved over the last year, inland facilities have become chronically congested with increasing rail dwell times, chassis shortages, and lack of storage space. BNSF and Union Pacific railroads are metering rail traffic from U.S. West Coast ports to avoid congested rail ramps in the Central U.S. The slowdown in rail volumes is causing backlogs at many of the U.S. West Coast ports. Disruptions to inland facilities can severely delay cargo even if it is offloaded from vessels in a timely manner.
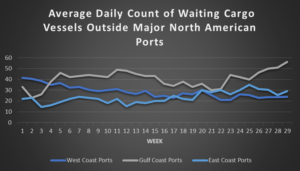
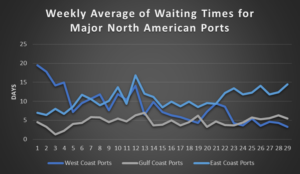
The Port of Los Angeles-Long Beach saw waiting times fall to just over 7 hours (0.3 days) on average continuing the pattern of clearing the backlog of vessels that built up last year. The average daily vessel count waiting at anchor decreased slightly from last week to four vessels. Despite the lower numbers for waiting times and vessel counts, the port will continue to face challenges in operational efficiency due to the backlog of rail containers. The combined waiting times for U.S. West Coast ports has fallen to the lowest of any coast.