Hurricane season, with its inevitable disruptions, is rapidly approaching. Recent Atlantic storms including Ida, Maria, Harvey, Laura, Dorian, and Irma devastated the regions they crossed. In the past five years, hurricanes have resulted in over $487 billion dollars in losses just in the U.S. Our hurricane season outlook will help you monitor potential risk to key supply chain hubs.
Key signals to watch
While there is no way to predict whether a specific city, port or facility will get severely impacted by a hurricane during the upcoming season, there are signals that allow us to assess and predict risk in the Atlantic Basin. In other words, is the risk going into this season higher than normal or lower than normal? To do this, we can investigate oceanic and atmospheric variables to gauge whether the risk is higher or lower than average.
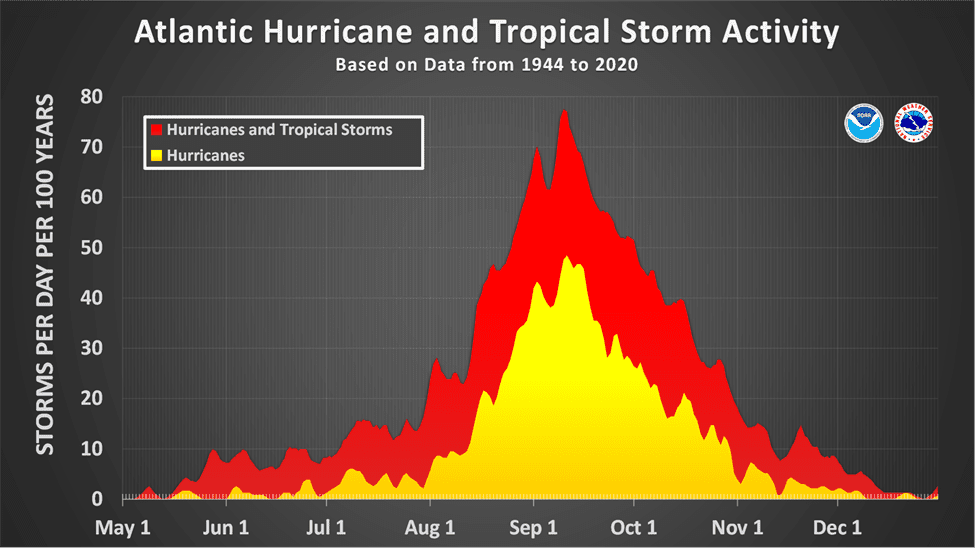
First, we will look at the climatology of storms in the Atlantic Basin – Gulf of Mexico, Caribbean, and Atlantic. The graph below is the timeline of tropical activity (tropical storms and hurricanes) in the Atlantic Basin from 1944 to 2020. Tropical systems can form as early as late May/June and occur as late as November/early December. The peak of the season, timeframe of highest risk, is from mid-August to mid-October with September being the most active month. Based on history, the peak of the season is September 10.
Outlook indicates above-normal activity
The past six seasons have featured above-normal tropical activity, which is unprecedented in recent times. The graph below portrays each season’s Accumulated Cyclone Energy (ACE) value, which is a way to measure the amount of destructive energy accumulated by tropical cyclones during each season. This is a much better benchmark than simply counting the number of named storms since ACE considers intensity and duration of storms at 6-hour intervals! This is the true measure of how active or inactive the total season is.
The average seasonal ACE value during this 42-year period is 111. Thus, last year’s value of 145 was significantly – 31% to be exact – above normal. The highest ACE year was 2005 while the lowest was 1983. Seasons with above-normal ACE equate to higher-than-normal risk while seasons with below normal ACE have lower risk for major and long-lasting supply chain disruptions.
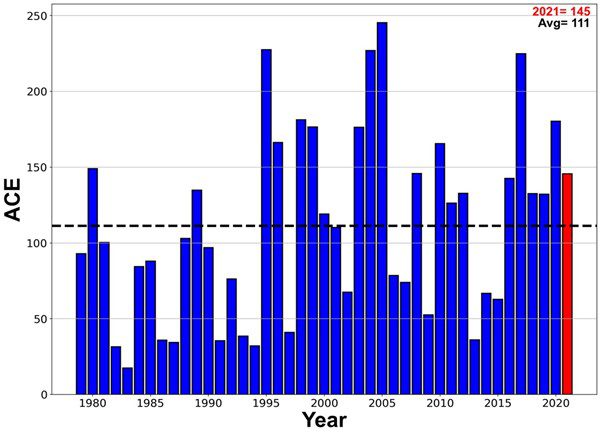
This year promises to be the seventh in a row with above-normal ACE since we expect an active season in the Atlantic Basin. As a result, there is an above-normal risk of disruptions within the supply chain network in the Atlantic Basin. This profound statement is largely driven by sea surface temperatures (SSTs) in the Pacific Ocean.
How to read La Niña and El Niño
Figure 3 shows the sea surface temperature anomalies in degrees Centigrade; red areas portray warmer than normal SSTs while blue areas are below-normal water temperatures. The key driver of the frequency and magnitude of tropical storms and hurricanes in the Atlantic Basin lies in the equatorial Pacific. A La Niña event (defined as cooler than normal SSTs in the central and eastern Pacific along the equator) is currently in place and is expected to remain in place during the bulk, if not all, of the upcoming season.
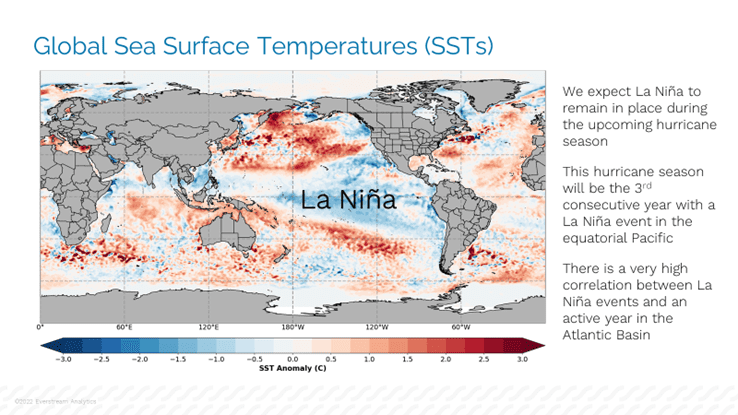
Why is this important? During La Niña events, the jet stream that forms over the eastern Pacific and eventually tracks across the Atlantic Basin (Caribbean, Gulf of Mexico, and Atlantic) is weaker. Weaker upper-level winds equate to less shear and less disruption to potential storms. There is a strong correlation between La Niña events in the Pacific Ocean and an active/disruptive hurricane season in the Atlantic Basin. The opposite is true for El Niño events – warmer than normal SSTs in the equatorial Pacific.
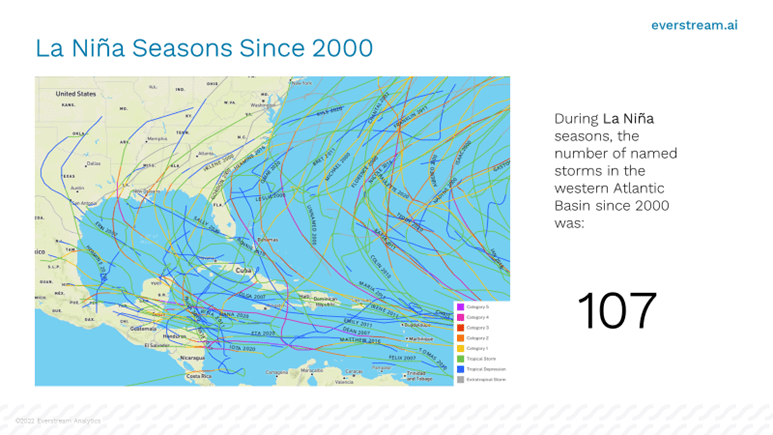
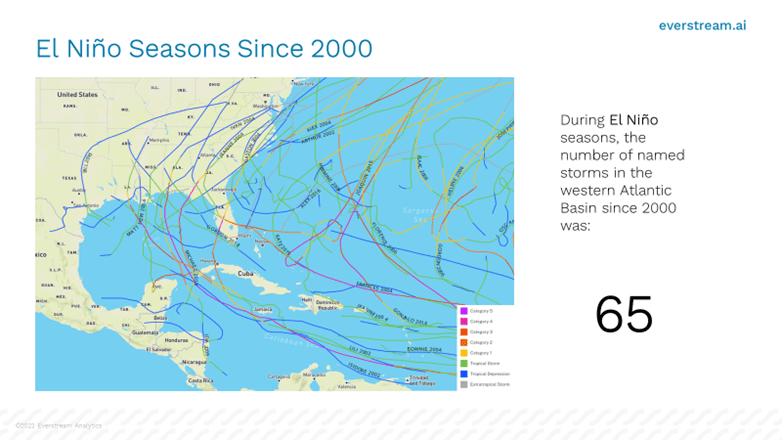
Figures 4 and 5 show the statistics. In seasons since 2000 with a La Niña in place, there have been 107 named storms (hurricanes and tropical storms) in the Atlantic Basin – the tracks of these storms are portrayed on the map. During El Niño seasons, there have been 65 names storms since 2000. Simply, La Niña seasons tend to be more active with higher risk of damage, disruptions, and supply chain impacts. With the current strong La Niña event expected to continue throughout the upcoming season, we expect this season to be the 7th consecutive year with above normal tropical activity, above normal risk, and above normal disruptions within the supply chain.
Get more insights into global weather risks in our report on the Paraná River drought.