The global supply chain has been dramatically impacted by flooding during the past year. Major events have occurred in every continent and caused severe damage to infrastructure, disruptions to transportation (road, rail, air, and port), and devasting societal impacts – fatalities and loss of homes/businesses.
What about the other side of the spectrum? Flood events tend to make the headlines since they are typically short-term incidents that have major ramifications. Droughts, on the other hand, evolve over extended periods. While the timescale is different, the impacts can be just as significant.
As we transition from winter to spring in the Northern Hemisphere and summer to fall in the Southern Hemisphere, there are numerous areas that have evolved into severe dryness (drought). Impacts have already occurred on account of these conditions – especially in the Southern Hemisphere. In the Northern Hemisphere, some impacts have already occurred, but the bigger concern is the future impacts on the supply chain during the upcoming warm season – spring and summer.
Here are a few of the “hotspots” that we are monitoring:
Brazil
The largest country in South America is one of the world’s most significant agricultural producers. Much of Brazil has experienced bouts of heat and below normal rainfall during the summer months; the December through February period is the core of summer in the Southern Hemisphere. The area that has had the driest conditions is the southeast portion of the country. The result of the extreme heat and dryness recently is shown in the graph below.
This graph depicts soil moisture percentiles (based on history) in the top one meter of soil. Soil moisture levels are the true measure of drought since it is the end result of periods of extreme dryness and heat. This soil depth (one meter) is the key to impacting crop development, hydrologic conditions such as levels of rivers/reservoirs, and water resources for people and industry (manufacturing for example).
As can be seen, current soil moisture levels are at the lowest 10 percent of all years; the entire database goes back to 1948. The soil moisture percentage is shown on the y-axis. The most acute conditions have been in the southeast portion of the country including the states of Sao Paulo, Parana, and Minas Gerais.
The current weekly value (week 11) features the lowest soil moisture conditions, going back to 2003. Hence, soil moisture conditions in this area are the lowest for the end of March since 2003. On the agricultural side, the extreme dryness has impacted late summer crop development for coffee, sugar cane, and citrus; southeast Brazil is the core growing area for these crops. The stress on the crops will hurt this season’s output. The ongoing situation is one of the many reasons why coffee prices are so elevated; Brazil is the largest global coffee producer. On the non-agricultural side, the acute dryness has stressed water resources for hydro-electric generation, manufacturing, and drinking water.
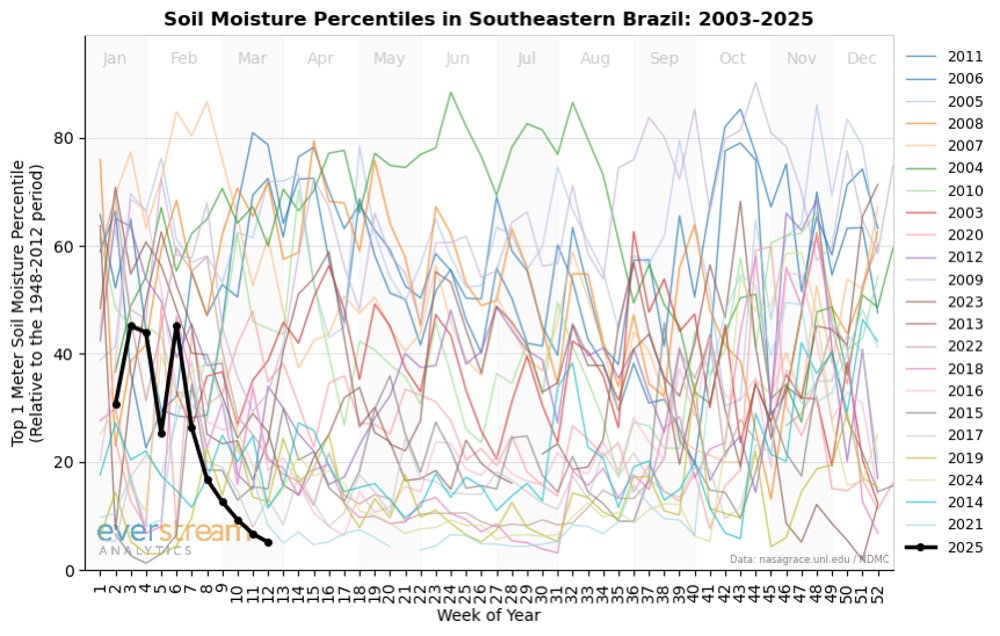 Figure 1 – Soil moisture percentiles over the past 22 years in drought hotspot Brazil
Southwest US/Northern Mexico
In the Northern Hemisphere, one of the “hotspots” that has developed is the Southwest US and northern Mexico. This area has been extremely dry since last fall and has started to impact a wide range of sectors including agriculture, livestock, and manufacturing.
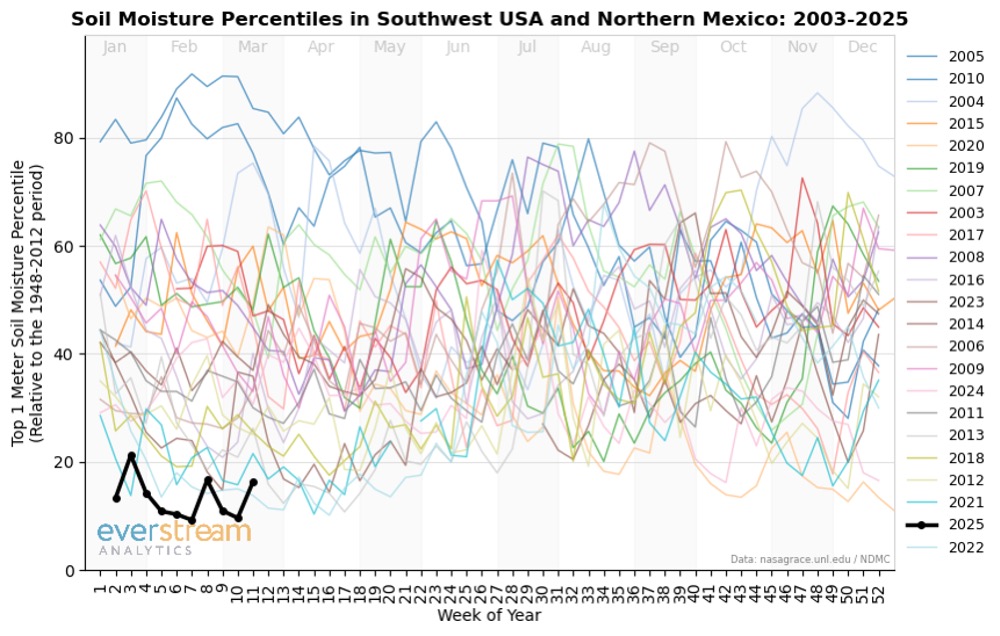 Figure 2 – Soil moisture percentiles over the past 22 years in drought hotspot SW USA and Northern Mexico
Soil moisture percentiles in this area are the second lowest for this time of year (week eleven or late March) since 2003. The impacts of this extreme dryness have ranged from crops (winter corn in northern Mexico) to livestock stress (the poor pasture conditions have not allowed cattle to graze), to water resources (the reservoir levels and mountain snowpack in the Southwest US are unusually low).
The concern going forward is that this area of extreme dryness will be a breeding ground for heat to build up later this spring and over the summer. Large areas of extreme dryness, especially in higher plateau areas such as the Southwest US and northern Mexico, are areas that are conducive for heat to build up during the warm season – later in the spring and summer. Does this portend to increased heat risk in portions of the US later in the spring and summer? Usually, it does. The other concern is the expansion of the current dryness into the western US (water resources impact) or in the central US (the heart of the US agricultural production). This area will have to be closely monitored during the upcoming spring/summer.
Europe
Europe, especially the central and eastern sections, has had a very dry winter. This has resulted in a decrease in soil moisture reserves to historically low levels. The current data (week eleven or the end of March) indicates that across all of Europe, this is the third lowest soil moisture percentile since 2003.
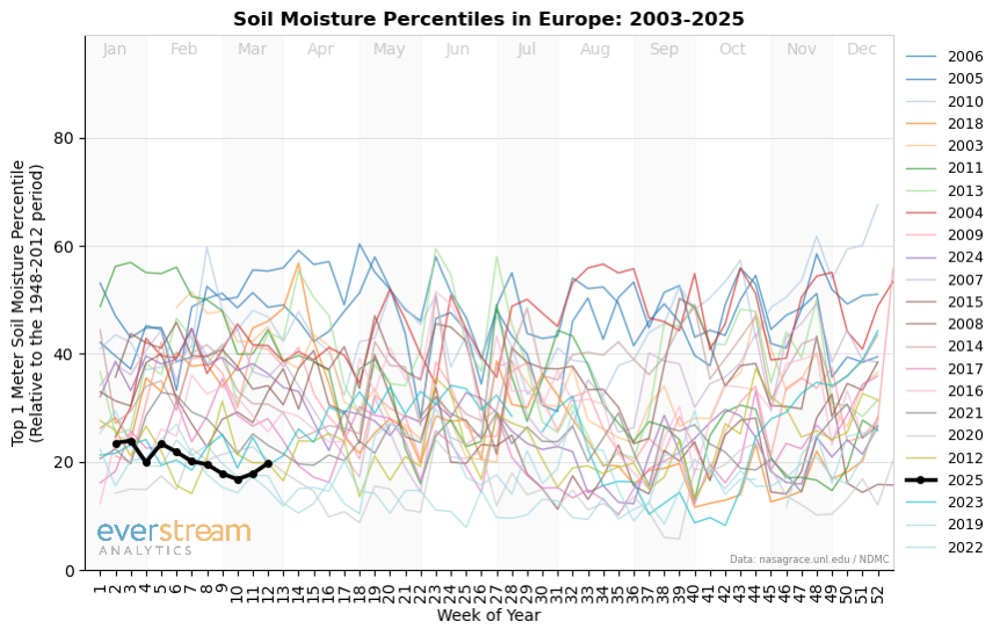 Figure 3 – Soil moisture percentiles over the past 22 years in drought hotspot Europe
On a regional basis, central and eastern Europe is the area that has the driest conditions going into the “warm season.” The map below depicts the soil moisture percentiles across the Continent. Here, soil moisture is defined as the top one meter of soil, and the percentiles are based on the 1948-2012 period. The reds represent a drier-than-normal condition, the blues represent wetter-than-normal soil moisture levels. As can be seen, the current situation features extremely low soil moisture levels across central and eastern Europe including the Black Sea region.
Planting of the summer crops is just starting. The soil moisture deficit is not a problem now, but it will quickly become one unless abundant rains develop this spring in the driest areas. As crop moisture demands increase later in the spring, this will be a critical area to monitor. This area (central and eastern Europe and the Black Sea region) is one of the most concentrated and important agricultural areas around the globe.
Longer-term, this area will be a source zone for heat to develop later in the spring and summer. Large-scale dry areas tend to be breeding grounds for heat to develop due to the lack of evaporative cooling. If the dryness persists in this area, the probability of unusual heat this summer increases. River transportation on key routes such as the Rhine and Danube will also have to be closely monitored since the river levels are starting on the low side of normal.
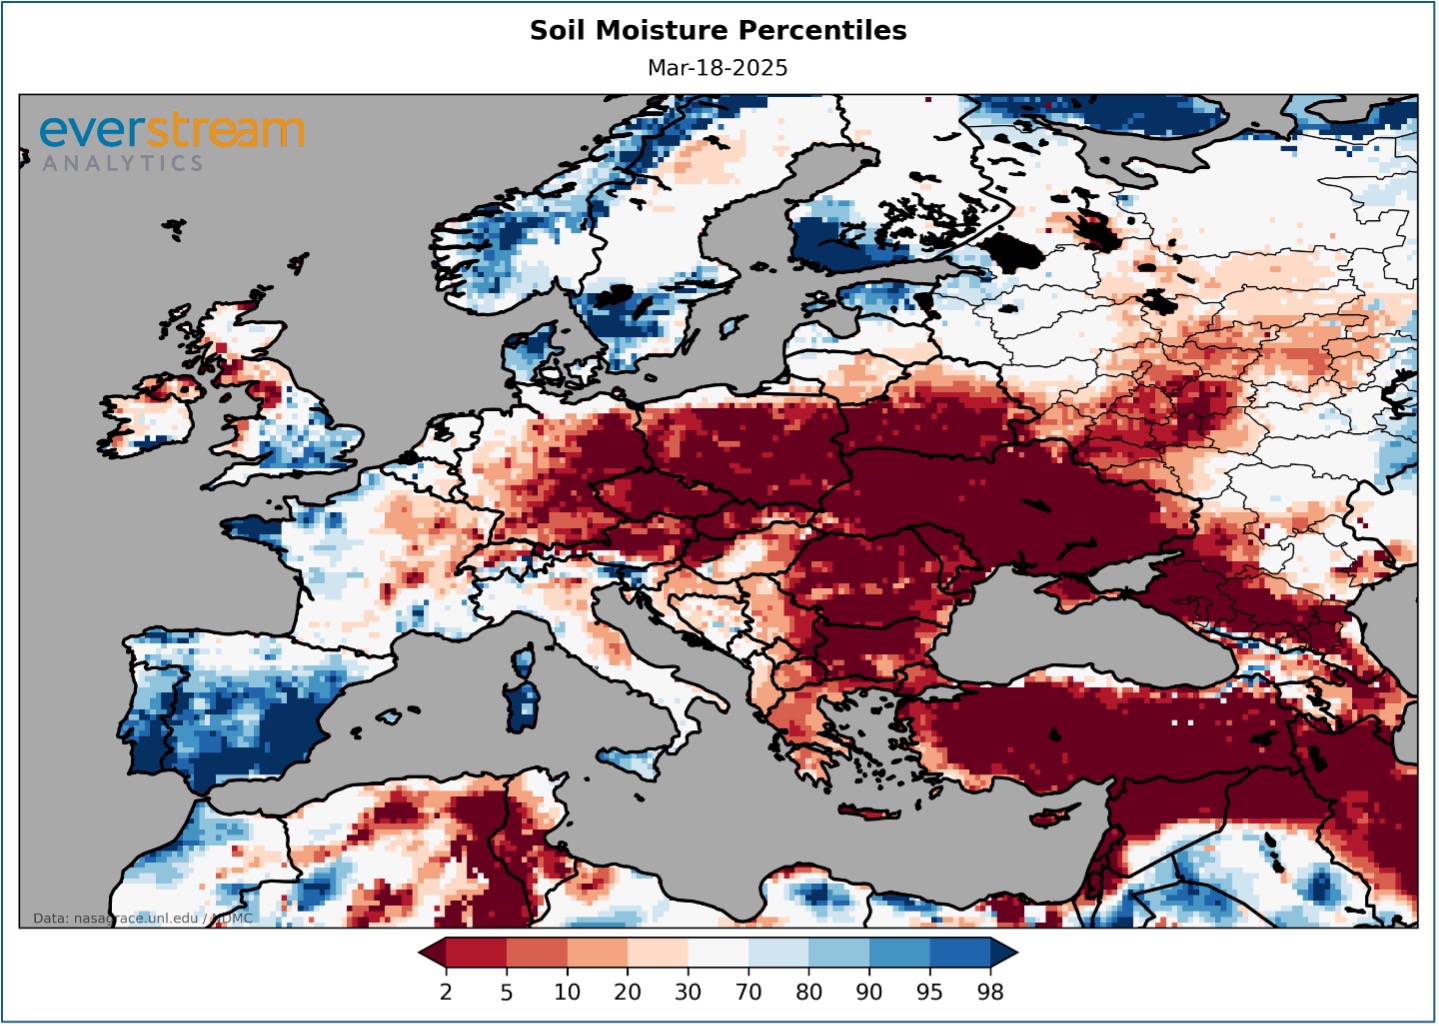 Figure 4 – Map view of soil moisture percentiles throughout Europe’s drought hotspots
These 3 “hotspots” are not the only areas to monitor going forward but, they are key contributors and influencers in the global supply chain. Agricultural impacts, which have already occurred in Brazil and Mexico, and energy impacts (lack of water for hydroelectric generation) are already impacting one part of the end-to-end supply chain in these areas. Possible impacts longer-term include a higher probability of heat waves during the upcoming warm season in portions of the US and Europe, water resource issues, transportation impacts, more widespread agricultural impacts, etc. Suffice it to say, that these “hotspots” will need to be closely monitored during the next few months.
Jon Davis
Jon Davis leads the Everstream Analytics weather and climate team as Chief Meteorologist. With over 35 years of experience, he is widely considered one of the foremost experts on the impact of weather and climate on global commodities and business.